
Quick Summary
Virtual power plants (VPPs) combine distributed energy resources such as smart thermostats, batteries, controllable plug loads, and behind-the-meter generation into one coordinated resource that can provide the grid services traditionally supplied by central power plants. New portfolios now reach multiple gigawatts and can be deployed in months, compared with years for new generation and transmission. For facility and energy managers, VPPs offer a new revenue stream through demand response and capacity markets, a practical way to cut peak demand charges, and a role in supporting grid reliability, often using equipment already in the building. This article explains how VPPs work, what real deployments have achieved, how the economics stack up, and how to get started.
The U.S. power grid is under pressure unlike anything seen in decades. Electricity demand is rising sharply, driven by AI data centers, domestic manufacturing, and electrification, while new generation and transmission take years to build. The North American Electric Reliability Corporation (NERC) projects summer peak demand will grow by about 224 GW over the next ten years, the fastest rate since it began tracking in 1995, and finds 13 of 23 North American regions face elevated or high reliability risk [1]. The U.S. Energy Information Administration (EIA) projected that commercial-sector electricity sales would exceed residential sales in 2026 for the first time since it began collecting the data [2].
Prices are following. In PJM, the largest U.S. grid operator, capacity prices in Pennsylvania load zones rose from about $12,500–$18,100 per MW-year for the 2023/2024 delivery year to about $121,700 per MW-year for 2027/2028, increases of 574% to 877% [3]. PJM’s most recent auction, for 2028/2029, cleared at its $325/MW-day price cap for the third straight time and still fell 6,831 MW short of its reliability requirement [4].
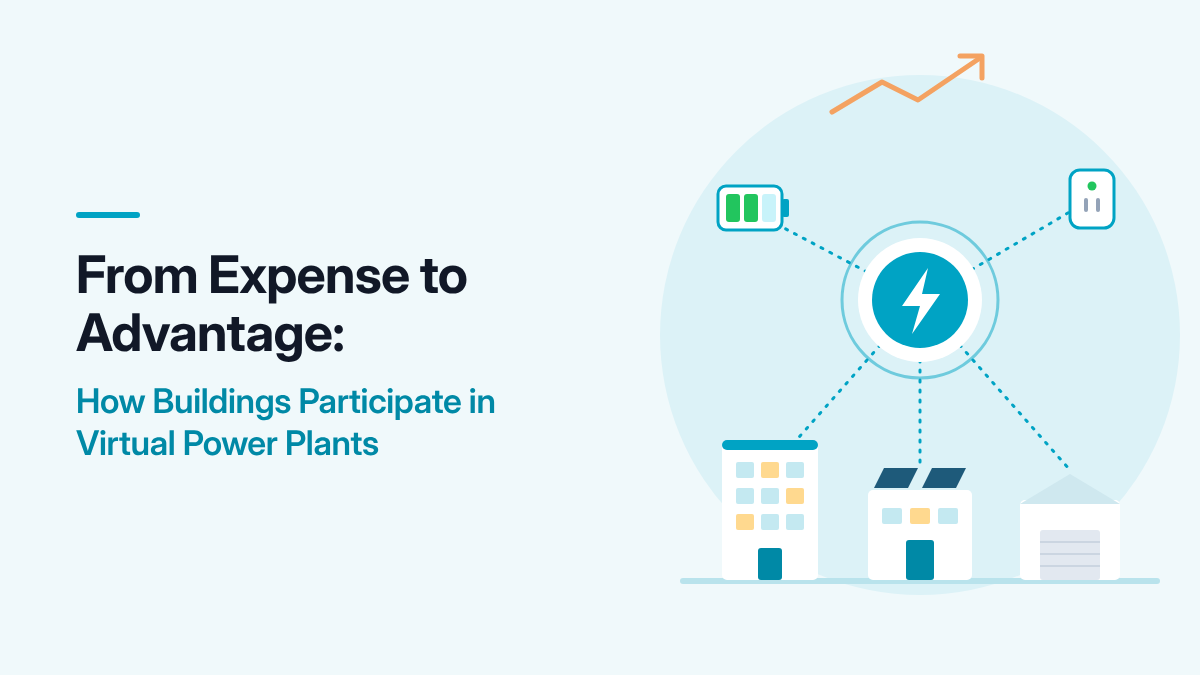
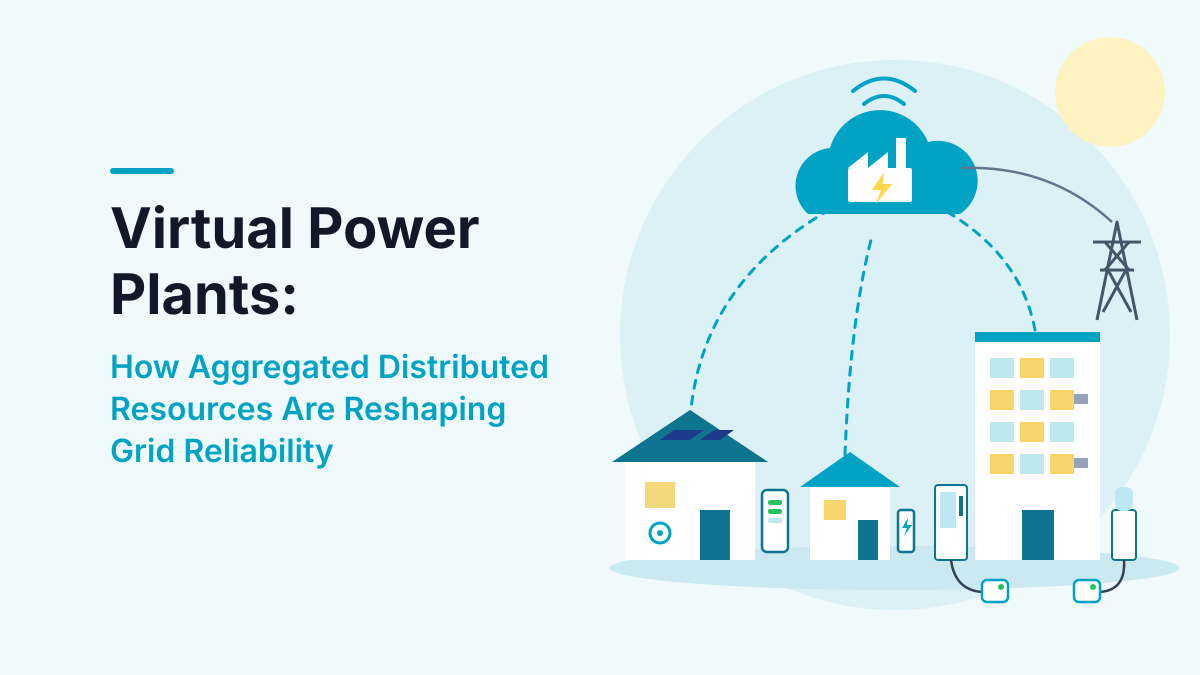
Against this backdrop, virtual power plants have moved from concept to commercial reality. A virtual power plant aggregates distributed energy resources (DERs), including rooftop solar, behind-the-meter batteries, smart thermostats, controllable plug loads, electric vehicle chargers, and industrial process loads, into a single dispatchable resource that can provide capacity, energy, and ancillary services. Unlike a traditional power plant, a VPP has no single physical location. Its “generation” comes from reducing consumption or discharging stored energy across hundreds or thousands of sites, coordinated by software.
In June 2026, Sunrun, Renew Home, and Tesla announced a partnership combining more than 8 million smart thermostats and devices with hundreds of thousands of home battery systems into more than 16 GW of flexible capacity, which the companies call the largest distributed power plant in the country [5]. They are offering it to hyperscalers and utilities, with more than 300 MW available now in Virginia, a target of at least 500 MW there by 2030, and over 1 GW that could be unlocked in PJM if the grid operator accepts their offer. The companies say the capacity can be deployed in months, not years [5].
This residential example shows the core VPP value proposition: unlocking flexibility in equipment that is already installed. The same principle applies to commercial and industrial facilities, where plug loads, HVAC, refrigeration, lighting, and process loads are a large and mostly untapped resource. Plug and process loads account for roughly one-quarter to one-third of commercial building electricity use [8], and most operate outside traditional building automation systems. BOSS Controls, a Pennsylvania-based energy management company, says its platform reaches the 95% of loads that are uncontrolled today.
From Plug Loads to Grid Assets
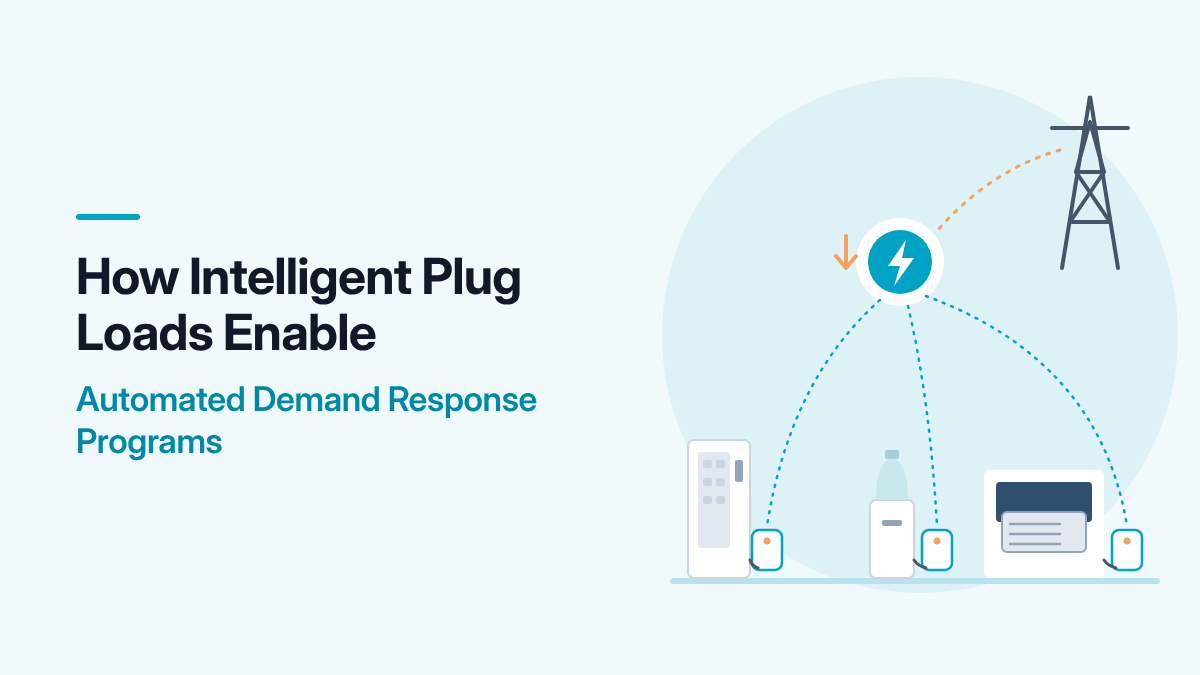
The path from individual device control to VPP participation follows a practical progression. First, facility teams gain visibility into device-level energy use through smart plugs or embedded controllers that measure real-time power and energy. Second, scheduling and automation cut waste during unoccupied hours, including nights, weekends, and holidays. Third, the same controllable loads can be dispatched during grid events for demand response, peak shaving, or other grid services.
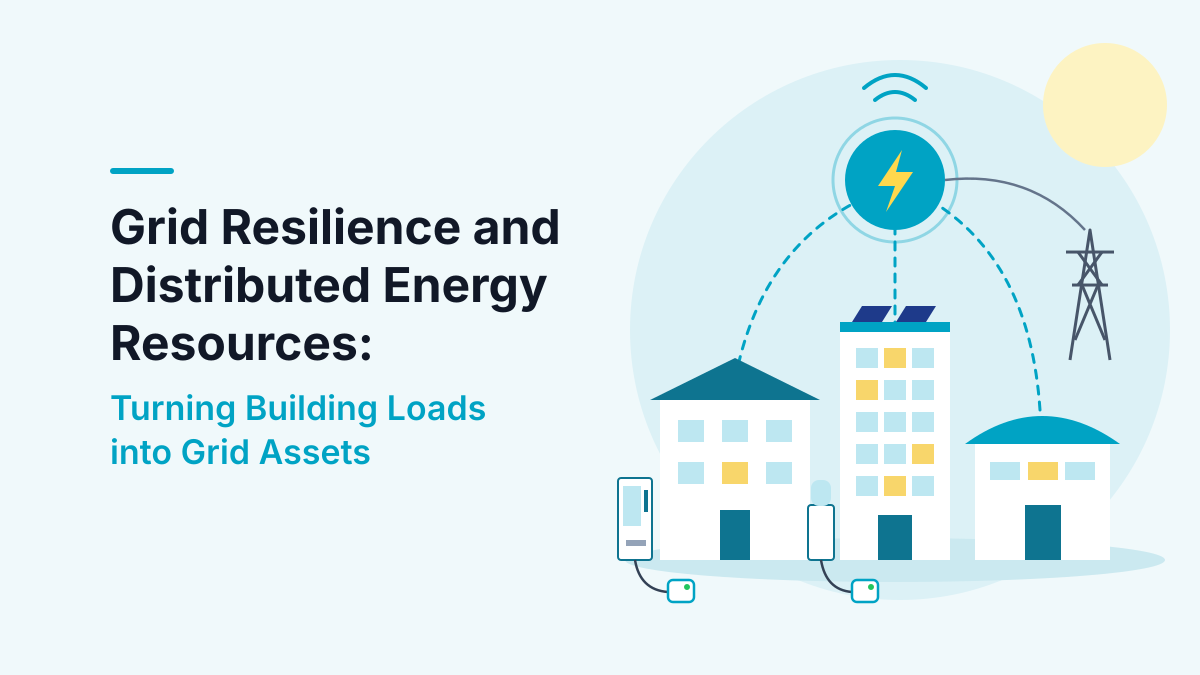
BOSS Controls has demonstrated this progression in several deployments. (For more case study detail, see our article on grid resilience and distributed energy resources.)
Municipal Office Portfolio: Window Air Conditioners
A large municipal agency manages 15 million square feet of mostly older office space cooled by window air conditioning units. BOSS installed 419 grid-interactive smart plugs on 120V and 220V window A/C units. Over the May–September cooling season, the agency reported [14]:
- 765 MWh of energy reduction from off-hours automation
- $114,730 in energy savings
- $125,700 in new demand response revenue
- 481 kW of additional load under management for demand response
The results were announced in a joint press release and show how existing buildings can become grid-supportive without replacing major infrastructure.
Smart City Deployment: NIST Global City Teams Challenge
Under the National Institute of Standards and Technology (NIST) Global City Teams Challenge, BOSS partnered with a mid-sized U.S. city, a major research university, and a commercial office high-rise to install smart plugs across municipal, university, and commercial buildings. After a baseline of at least 14 days, devices were scheduled off during unoccupied periods. Savings exceeded 50% for targeted plug loads, with simple payback under one year and as short as four months for high-consumption equipment [15]. The project also demonstrated cloud-based control supporting automated demand response events down to the individual plug, with measurement and verification. Based on 2015/16 PJM demand response program values, each smart plug added about $9.10 of average annual value beyond energy savings [15].
These results fit the broader case for VPPs. The U.S. Department of Energy (DOE) estimates about 30 GW of VPP capacity is enrolled in the U.S. today and calls for 80–160 GW by 2030, enough to serve 10–20% of peak load [6]. DOE also reports that basic utility VPP programs can be launched in under six months [6].
The Economics of Aggregation
VPP economics depend on stacking several value streams. For a facility owner, these include:
Energy cost reduction: Scheduling controllable loads off during unoccupied hours directly cuts consumption. BOSS device data, assuming 50% off-time and $0.10/kWh, shows annual savings ranging from 5,037 kWh for a 220V PTAC (4-month payback) to 1,717 kWh for a refrigerated drink vending machine (7-month payback) [17]. At larger scale, sports venue deployments projected a 12-month payback for 750 devices and a 9-month payback for 2,000 devices [16].
Demand charge reduction: Many commercial tariffs include demand charges based on peak 15-minute or hourly usage. Coordinated load reduction during a facility’s peak window can lower this charge, and VPP platforms can automate it by targeting the highest-consuming devices first.
Demand response revenue: Wholesale markets (PJM, NYISO, ISO-NE, CAISO, ERCOT) and utility programs pay for committed load reduction during grid events. The municipal window A/C project earned $125,700 in demand response revenue over one season from 419 plugs, about $300 per plug [14]. The smart city project valued PJM demand response at about $9.10 per plug per year using older 2015/16 program values [15], well before today’s higher capacity prices.
Capacity payments: In capacity markets, aggregators can bid combined load reduction as a capacity resource and earn payments for availability. With PJM capacity clearing at the price cap in each of its last three auctions [4], this value stream has grown substantially. Corporate buyers are now procuring it directly. In June 2026, Google signed a three-year agreement with Voltus for 100 MW of distributed capacity in PJM [9], and in October 2026 the companies expanded the commitment to a 1 GW virtual power plant [10].
Ancillary services: Fast-responding resources such as batteries and certain industrial loads can provide frequency regulation and reserves, which often command higher prices than energy or capacity alone but require faster telemetry and response.
For utilities and grid operators, VPPs can be cheaper than building new supply. In an analysis cited by DOE, The Brattle Group estimated the net cost of providing 400 MW of resource adequacy at about $43/kW-year for a VPP, compared with $69/kW-year for a utility-scale battery and $99/kW-year for a gas peaker [6][7]. VPPs can also defer distribution investments. DOE highlights a New York utility that deferred a $1.2 billion substation upgrade by spending $200 million on distributed resources and demand reduction instead [6].
Energy Savings Calculator
Start your VPP readiness with the savings you can lock in now. Enter your window units, vending machines, water coolers, and other plug-in equipment to estimate annual energy use, annual and five-year savings, and CO2 avoided.
Technical Requirements for VPP Participation
Not every controllable load is immediately VPP-ready. Effective aggregation requires several technical capabilities:
Measurement and verification (M&V): Grid operators and programs require proof of performance, and timestamped device-level or sub-metered data is the baseline. The BOSS Atmospheres platform, for example, collects energy consumption, power demand, device status, operating schedules, load reduction, and historical trends to support baseline analysis and savings verification.
Secure, reliable connectivity: Dispatch signals must reach devices quickly and reliably. BOSS uses a dedicated secure IoT network that the company says is certified for both Verizon’s and utility private LTE networks, keeping energy devices separate from general building IT networks. DOE identifies standardized cybersecurity responsibilities and device interoperability as part of one of five imperatives for scaling VPPs [6].
Automation and orchestration: Manual response is too slow for most grid services. VPP platforms must translate grid signals, such as prices, demand response events, or frequency deviations, into device-level actions automatically while respecting occupant comfort, operational limits, and contract terms. The smart city project demonstrated automated demand response down to the individual plug, with measurement and verification [15].
Interoperability and standards: The Internet of Things Energy Association (IoTEA), a nonprofit public-private partnership, works to set standards and certify end-to-end technology components for DER control, communication, measurement, and verification. The goal is to prevent vendor lock-in and let utilities integrate diverse resources without custom integration, much as the Wi-Fi Alliance does for wireless networking.
Market Drivers Accelerating VPP Adoption
Several converging trends are speeding up VPP deployment:
AI data center demand: AI training and inference create large, concentrated, around-the-clock loads, and data centers are a primary driver of NERC’s record demand forecast [1]. Data center operators are responding by funding VPP capacity, as Google’s 1 GW agreement with Voltus in PJM shows [10].
Capacity price spikes: PJM capacity prices for 2027/2028 are 574–877% above 2023/2024 levels in Pennsylvania zones [3], and the 2028/2029 auction cleared at the cap again [4]. High capacity prices raise the value of every kilowatt of load reduction.
Interconnection queues: New generation projects face years of interconnection studies. DOE notes that the median time from interconnection request to commercial operation is about 40 months for a utility-scale battery and 42 months for a gas plant [6]. VPPs, located at the load, avoid most of those delays.
Policy and market access: FERC Order 2222 (2020) requires grid operators to let DER aggregations of 100 kW or more participate in wholesale markets [11]. PJM’s full DER aggregation model goes live in February 2028 [13], and its 2028/2029 auction was the first in which DER aggregations could offer capacity. None did [12], which leaves room for early participants.
Growth of behind-the-meter devices: Rooftop solar, home and commercial batteries, EV chargers, and smart thermostats keep multiplying, and each is a potential VPP node. The Sunrun, Renew Home, and Tesla portfolio of more than 8 million thermostats and devices shows how much is already installed [5].
Practical Steps for Facility and Energy Managers
For facility teams evaluating VPP participation, a practical approach starts with the equipment already in the building:
- Inventory controllable loads. Identify plug loads, HVAC, refrigeration, lighting zones, and process loads that can be reduced or shifted without disrupting operations. Window A/C units, PTACs, vending machines, water coolers, dehumidifiers, air purifiers, and electric heaters are common starting points.
- Establish baselines. Meter target loads for at least two weeks to understand consumption patterns, peak contribution, and unoccupied-hour waste. The smart city project used a 14-day baseline before setting schedules [15].
- Implement scheduling and automation. Deploy smart plugs, controllers, or building automation integration to schedule off-hours shutdown. This captures immediate savings and builds the control infrastructure needed for VPP dispatch.
- Evaluate demand response programs. Contact your utility or a curtailment service provider (CSP) to learn about available programs, including emergency and economic demand response, capacity bidding, and utility peak-reduction incentives. Many programs now accept aggregated small loads.
- Engage an aggregator or platform provider. VPP participation usually requires an aggregator to handle market registration, telemetry, dispatch, settlement, and compliance. Options include established CSPs, utility programs, and platforms like BOSS that combine appliance-level control with VPP readiness.
- Plan for measurement and verification. Make sure your platform provides the data detail and reporting your programs require. Interval data at 15 minutes or finer is increasingly standard.
- Stack value streams. Model the combined economics of energy savings, demand charge reduction, demand response revenue, and capacity payments. The municipal window A/C project shows how energy savings ($114,730) and demand response revenue ($125,700) together build a compelling business case [14].
The Evolving VPP Landscape
The VPP concept is expanding beyond load reduction. DOE’s roadmap calls for simpler enrollment, standardized VPP operations, integration into utility planning, and fuller access to wholesale markets [6]. BOSS’s product roadmap goes further, describing a “Virtual Power Exchange” in which distributed devices autonomously buy and sell energy and grid services, including wholesale market arbitrage for behind-the-meter loads and a decentralized energy market with real-time, peer-to-peer, bi-directional trading.
Google’s PJM agreements, the Sunrun, Renew Home, and Tesla portfolio, and utility programs across the country mark the early commercial phase. The technology stack of secure connectivity, device-level control, M&V, and automation is maturing, standards efforts like IoTEA are addressing interoperability, and capacity markets are opening to aggregated DERs.
For facility and energy managers, the message is practical: the window A/C units, vending machines, water coolers, plug-in heaters, and office equipment in your buildings today are likely underused as grid assets. Connecting them to a control platform captures immediate savings and positions you for VPP participation as programs mature. The municipal and smart city deployments show this is achievable in existing buildings without major capital upgrades.
Key Takeaways
- VPPs turn distributed resources into grid-scale capacity. Batteries, smart thermostats, controllable plug loads, and on-site generation can be combined into one dispatchable resource that provides capacity, energy, and ancillary services [6].
- Commercial plug loads are a large, untapped resource. Plug and process loads use roughly one-quarter to one-third of commercial building electricity [8], and most sit outside building automation systems.
- Results are proven in existing buildings. A municipal deployment of 419 smart plugs on window A/C units delivered 765 MWh of savings, 481 kW of demand response capacity, and about $240,000 in combined value in one season [14]. A NIST smart city project achieved more than 50% plug load savings with payback under one year [15].
- Stacked value streams drive the economics. Energy savings, demand charge reduction, demand response revenue, capacity payments, and ancillary services can combine, and VPP capacity costs utilities less than batteries or gas peakers [6][7].
- Market drivers are accelerating. NERC projects record demand growth [1], PJM capacity has cleared at its price cap three auctions in a row [4], Google is funding a 1 GW VPP [10], and FERC Order 2222 is opening wholesale markets to aggregated DERs [11].
- Start with what you have. Inventory controllable loads, set baselines, implement scheduling, evaluate demand response programs, and engage an aggregator. No major building system replacement is required.
References
- North American Electric Reliability Corporation. 2025 Long-Term Reliability Assessment. January 2026.
- American Public Power Association. “EIA sees commercial sector electric sales exceeding residential sector for first time in 2026.” August 2025.
- NRG Energy. PJM Historical Base Residual Auction Results. See also PJM Interconnection, 2027/2028 Base Residual Auction Report, December 2025.
- PJM Interconnection. “PJM Capacity Auction Procures 138,318 MW of Generation Resources.” Press release, July 14, 2026.
- Sunrun. “Sunrun, Renew Home, and Tesla Team Up to Deliver More Than 16 Gigawatts of Fast, Flexible Power for Data Centers and Large Loads.” Press release, June 24, 2026.
- U.S. Department of Energy. Pathways to Commercial Liftoff: Virtual Power Plants 2025 Update. January 2025.
- The Brattle Group. Real Reliability: The Value of Virtual Power. May 2023.
- National Renewable Energy Laboratory. Assessing and Reducing Plug and Process Loads in Office Buildings. 2013.
- Energy-Storage.news. “Google signs 100MW distributed energy resource VPP agreement with Voltus for PJM.” June 2026.
- Google. “We are working with Voltus to build a 1-gigawatt virtual power plant.” October 22, 2026.
- Federal Energy Regulatory Commission. FERC Order No. 2222 Explainer: Facilitating Participation in Electricity Markets by Distributed Energy Resources.
- POWER Magazine. “PJM’s 2028/2029 Capacity Auction Falls Short of Reliability Standard for Second Straight Year.” July 2026.
- PJM Interconnection. DER Aggregator Participation Model: Full Model Design. Distributed Resources Subcommittee, March 2026.
- BOSS Controls. Case Study: Municipal Office Portfolio Window A/C Smart Plug Deployment. Case study.
- BOSS Controls. Case Study: Plug Load Energy Management, NIST Global City Teams Challenge. Case study.
- BOSS Controls. Energy Savings at the Plug Load: Stadiums. Case study.
- BOSS Controls. Energy Consumption by Device Type. June 2017.