
Quick Summary
Electricity demand is rising faster than new power plants and transmission lines can be built, and grid operators are now warning of real reliability risk. Distributed energy resources (DERs), aggregated into virtual power plants (VPPs), are the fastest way to add flexible capacity, and commercial plug loads are one of the largest untapped sources of it. Plug and process loads account for roughly a quarter to a third of commercial building electricity, yet most sit outside building automation and utility programs. This article explains why grid resilience now depends on the demand side, how VPPs turn building loads into revenue, what real smart plug deployments have achieved, and how facility teams can get started.
The Grid Resilience Challenge Is No Longer Theoretical
The North American Electric Reliability Corporation (NERC) 2025 Long-Term Reliability Assessment, released in January 2026, projects that summer peak demand will grow by about 224 GW over the next ten years. That is roughly 69% more growth than the previous year’s forecast, and the fastest rate since NERC began tracking in 1995. NERC found that 13 of 23 North American assessment areas face elevated or high resource adequacy risk, and expects PJM’s summer peak alone to grow by about 56 GW by the mid-2030s, driven by data centers, electrification, and manufacturing [1].
The U.S. Department of Energy (DOE) puts the national picture in similar terms: peak demand is expected to rise from roughly 800 GW in 2024 to about 900 GW by 2030 [2]. Traditional supply cannot keep pace. DOE notes that the median time from interconnection request to commercial operation is about 40 months for a utility-scale battery and 42 months for a gas plant, before transmission constraints are considered [2].
Against this backdrop, distributed energy resources have moved from pilot-scale curiosity to operational necessity. DOE’s Pathways to Commercial Liftoff: Virtual Power Plants 2025 Update calls for 80–160 GW of VPPs by 2030, enough to serve 10–20% of U.S. peak load, up from about 30 GW today [2]. Cost is a major reason. In an analysis cited by DOE, The Brattle Group estimated the net cost of providing 400 MW of resource adequacy at about $43/kW-year for a VPP, compared with $69/kW-year for a utility-scale battery and $99/kW-year for a gas peaker [2][3].
Distributed Energy Resources as a Resilience Strategy
DERs include any resource on the distribution system that can provide value to the grid: rooftop solar, behind-the-meter batteries, electric vehicles (managed charging and vehicle-to-grid), thermal storage, and controllable loads. The defining characteristic is location. Because DERs sit behind the customer meter, they can be deployed in months rather than years and avoid transmission congestion. DOE reports that basic utility VPP programs can be launched in under six months [2].
The resilience value of DERs operates at three levels:
Distribution-level resilience: Local resources can keep critical loads running during outages and can shave localized peaks that would otherwise force costly equipment upgrades. DOE highlights utilities using VPPs to defer distribution investments while demand grows [2].
Bulk-system resilience: Aggregated DERs can supply capacity and grid services traditionally provided by central generation. Emergency programs show what flexible load is worth when the grid is stressed. California’s Emergency Load Reduction Program, triggered by CAISO grid emergencies, pays non-residential customers $2 per kWh (equivalent to $2,000/MWh) of verified load reduction [4].
Market-level resilience: DER participation adds supply diversity to wholesale markets. FERC Order 2222 (2020) directs grid operators to let DER aggregations of 100 kW or more compete in wholesale capacity, energy, and ancillary service markets [5]. In PJM, DER aggregations could offer into a capacity auction under the Order 2222 model for the first time in the 2028/2029 auction, with full market implementation scheduled for February 2028 [6]. No DER aggregation capacity was offered in that first auction [7], so the opportunity for early participants remains wide open.
Virtual Power Plants: Aggregation Makes DERs Grid-Scale
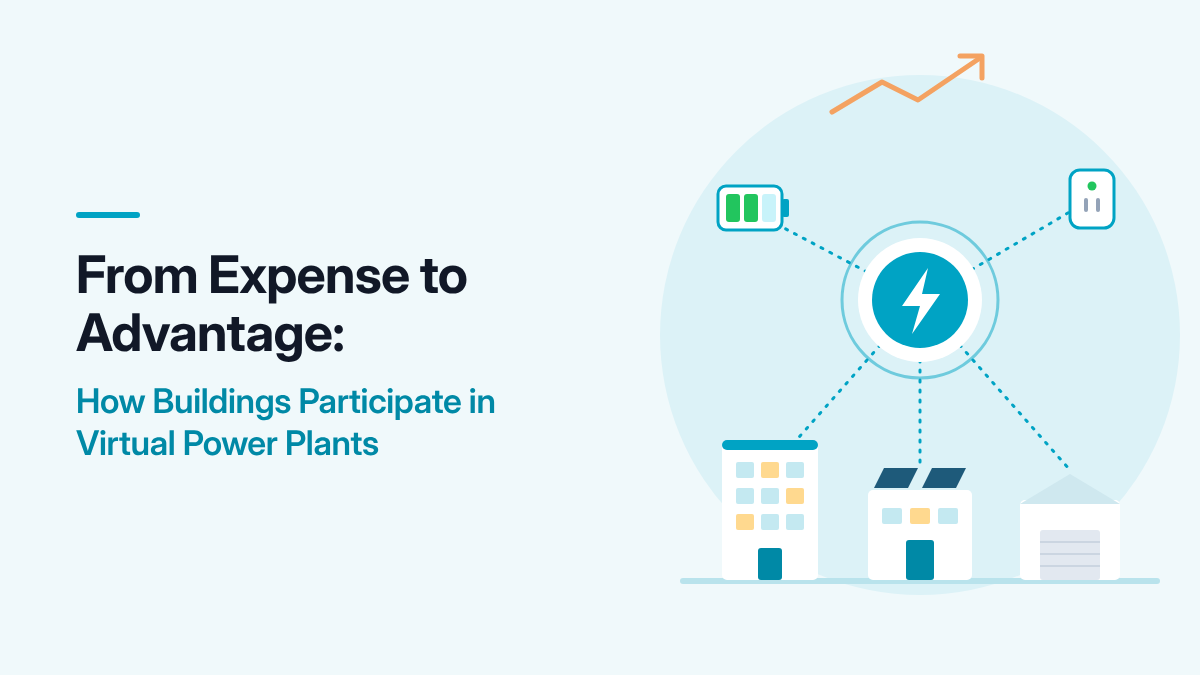
A virtual power plant is not a physical plant. It is a software platform that aggregates hundreds or thousands of behind-the-meter resources, optimizes them against grid signals and market prices, and presents them to the grid as a single dispatchable resource. The concept has evolved through three broad generations:
| Generation | Timeframe | Key Characteristics | Examples |
|---|---|---|---|
| VPP 1.0 | 2010–2018 | Demand response aggregation, mostly large commercial and industrial curtailment | Traditional C&I demand response aggregators |
| VPP 2.0 | 2018–2023 | Mixed asset types (battery, solar, thermostats), automated dispatch, behind-the-meter optimization | Residential battery and smart thermostat fleets |
| VPP 3.0 | 2023–present | Grid-interactive buildings, device-level (plug-load) granularity, wholesale market integration, corporate-funded capacity | Google-funded VPP in PJM (Voltus); plug-load platforms such as BOSS Controls |
The Google–Voltus partnership in PJM marks a turning point. In June 2026, the two companies signed a three-year agreement under which Voltus aggregates up to 100 MW of distributed resources from local businesses and homes into a Google-funded VPP [8]. In October 2026, Google expanded the commitment to build a 1 GW virtual power plant across the PJM region [9]. A hyperscale data center operator is now treating distributed flexibility as a capacity procurement target, not a demand response add-on.
For facility managers, VPP participation turns energy from a pure cost center into a potential revenue stream. Typical revenue streams include:
- Capacity payments: PJM’s 2028/2029 capacity auction cleared at $325/MW-day across the entire footprint (about $119/kW-year), the price cap, and still fell 6,831 MW short of its reliability requirement [10]. Participants in demand response typically receive a share of this value through their aggregator.
- Energy value: Shifting or reducing load during high-price hours.
- Ancillary services: Frequency regulation and reserves, which require faster telemetry and response.
- Utility and emergency programs: Peak-reduction programs, non-wires alternatives, and emergency programs such as California’s $2/kWh ELRP [4].
- Resilience value: Avoided outage costs when critical loads can be prioritized during grid stress.
Capacity prices have changed dramatically in a short time. PJM’s capacity price jumped from $28.92/MW-day for 2024/2025 to $269.92/MW-day for 2025/2026, an increase of roughly 830%, then rose to $329.17/MW-day for 2026/2027 [11]. The last three auctions have all cleared at the price cap [10].
Plug Loads: The Overlooked DER Resource
Plug and process loads (PPLs) account for about one-third of U.S. commercial building electricity use, according to research summarized by the National Renewable Energy Laboratory (NREL), and their share is growing as building systems become more efficient [12]. At the individual building level, they represent roughly 25% of the electrical load in a minimally code-compliant building and can exceed 50% in an ultra-efficient one [13]. In older buildings without central HVAC, window air conditioners and space heaters can consume a very large portion of total building energy. Yet PPLs remain largely invisible to building automation systems (BAS), which typically control only HVAC, lighting, and major mechanical equipment.
This visibility gap exists for structural reasons:
- Diversity: Hundreds of device types (vending machines, water coolers, space heaters, copiers, displays, lab equipment) with different load profiles.
- Dispersion: Devices scattered across floors, rooms, and buildings, with no centralized wiring.
- Turnover: Equipment churn means hardwired solutions become obsolete quickly.
- Tenant control: In leased spaces, tenants control plug loads while landlords control the BAS.
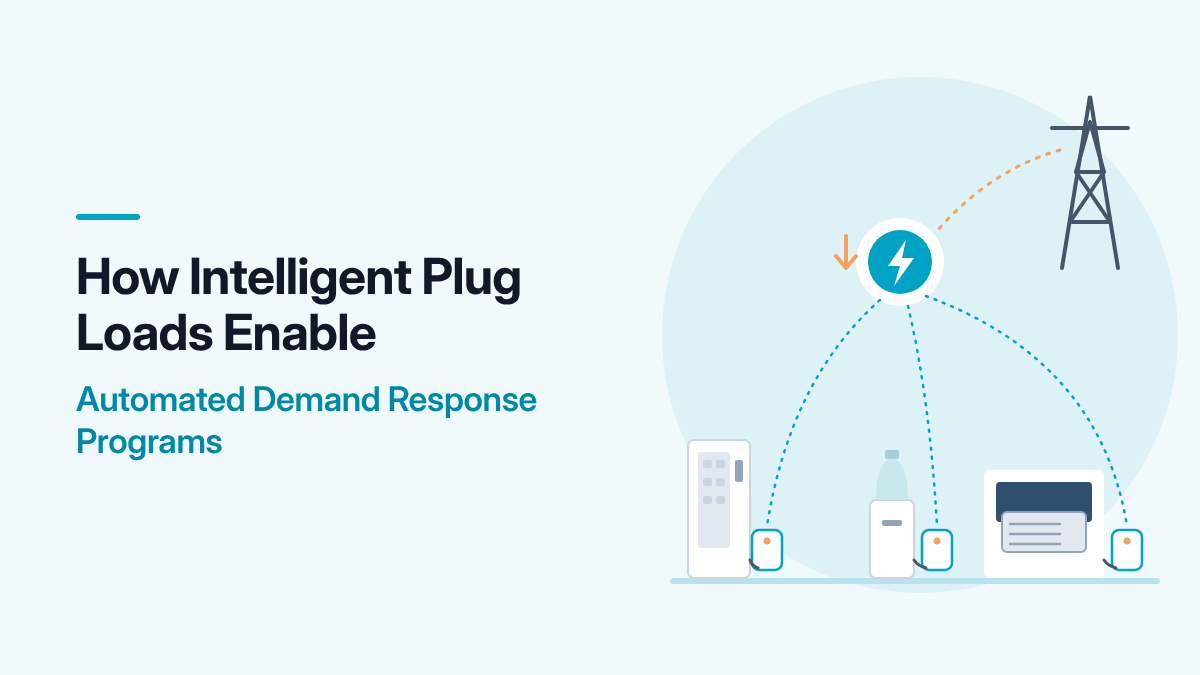
The result is that many plug loads run 24/7 regardless of occupancy. Controllable smart plugs solve the visibility and dispatchability problems at once. A smart plug with integrated metering, scheduling, and support for automated demand response signals becomes a dispatchable DER asset. At scale, the numbers add up quickly: 10,000 controlled plugs with 150 W of curtailable load each represent 1.5 MW of flexible capacity, deployable in weeks rather than years.
Case Studies: From Pilot to Portfolio
Smart City Deployment: NIST Global City Teams Challenge
Under the National Institute of Standards and Technology (NIST) Global City Teams Challenge, BOSS Controls partnered with a mid-sized U.S. city, a major research university, and a commercial office high-rise to install smart plugs across municipal, university, and commercial buildings. Targeted devices included water coolers and fountains, coffee pots, snack and soda vending machines, and copiers and printers. Each device was metered for at least 14 days to set a baseline, then scheduled off during unoccupied periods (weekday early mornings, evenings, and weekends) for at least 14 more days [14].
Results:
- More than 50% average energy reduction across all controlled devices, with device categories ranging from about 39% to 60% savings.
- Largest absolute savings on the highest-consuming equipment, such as soda vending machines.
- Simple payback under one year for all sites, and as short as 4 months for high-consumption equipment.
- About $9.10 of additional annual demand response value per plug, based on 2015/16 PJM program values [14].
The project also demonstrated three capabilities that matter for grid resilience: device-level measurement and verification, automated demand response events down to the individual plug, and aggregation of plug loads across multiple buildings and owners as a single portfolio [14].
Professional Sports Venues
Stadiums and arenas concentrate thousands of monitors, vending machines, water coolers, and concession appliances that run on event-driven schedules but are often left on between events. An NHL arena with LEED Operations and Maintenance certification deployed BOSS smart plugs across vending, display, and concession equipment [15].
Projected outcomes:
- 12-month projected payback for a 750-device deployment at an arena of about 18,500 seats.
- 9-month projected payback for a 2,000-device deployment at a stadium of about 75,000 seats.
- Operational savings from remote scheduling and alerts that replace manual walkthroughs [15].
The venue model demonstrates event-based optimization: loads are scheduled around game and event calendars, with real-time override for unscheduled use. This pattern of predictable baselines, event-driven peaks, and high per-device consumption maps directly to campuses, convention centers, and other large facilities.
Education Campuses: Four-Site Pilot Across Contrasting Climates
A pilot across four education facilities in two contrasting climate zones (a university, two high schools, and a middle school) deployed more than 300 controllers on vending machines, water fountains, window air conditioners, electric heaters, televisions, coffee makers, and computers [16].
Measured annual kWh savings per device:
- Chilled vending machine: 2,190 kWh
- Wall-mounted water fountain: 1,460 kWh
- Window air conditioner: 1,370 kWh (varies with climate)
- Electric space heater: 1,082 kWh (varies with climate)
- Television, 42″ and larger: 626 kWh
- Desktop workstation: 370 kWh
- Coffee pot: 290 kWh
Key insight: Heavy loads delivered simple paybacks of 4–6 months, and many smaller devices paid back in 12 months or less. The pilot also revealed devices, such as copiers, that consumed surprisingly little energy, which is exactly the data that prevents wasted control investment [16].
Energy Savings Calculator
See what your plug loads could become as a grid asset. Enter your vending machines, water coolers, window units, and other plug-in equipment to estimate annual energy use, annual and five-year savings, and CO2 avoided.
Standards, Interoperability, and Cybersecurity: The Enabling Stack
DER aggregation at scale requires a standards stack that is now coming together. DOE identifies standardization of VPP operations, including utility-aggregator interfaces, device interoperability, and cybersecurity responsibilities, as one of five imperatives for VPP growth [2].
Communication and Control
- OpenADR 2.0b (IEC 62746-10-1): A widely used open standard for sending automated demand response price and reliability signals to end devices.
- IEEE 2030.5: Used for communication between DERs and utility DER management systems, including smart inverter functions in California.
- Matter/Thread: Emerging for residential and small commercial device onboarding; not yet common in commercial and industrial settings.
Market Integration
- FERC Order 2222: Requires grid operators to create participation models for DER aggregations of 100 kW or more [5]. Grid operators are implementing on different timelines; PJM’s full model goes live in February 2028 [6].
- NAESB model contracts: DOE highlights the North American Energy Standards Board’s model grid services contract as a step toward standard terms between utilities and aggregators [2].
Cybersecurity
- NIST IR 8259 and IEC 62443: Baseline cybersecurity frameworks for IoT devices and industrial and building automation systems.
- Vendor security architectures: Some vendors go further. BOSS Controls’ CERA (Cybersecure Embedded Runtime Architecture), for example, implements post-quantum cryptography and hardware-rooted trust for utility-grade security on cellular networks such as Verizon private LTE and FirstNet.
Interoperability Certification
- IoTEA (Internet of Things Energy Association): A nonprofit public-private partnership, working with the Energy Innovation Center, that is establishing end-to-end certification for DER components covering security, communication, measurement, and grid interoperability across vendors.
Without this stack, every VPP deployment is a custom integration project. With it, facility managers can specify certified, standards-based equipment in procurement and expect multi-vendor interoperability.
Economic Framework: Building the Business Case
For facility and energy managers, the business case for controllable plug loads rests on three pillars: energy savings, grid services revenue, and resilience value. The example below uses a consistent, plug-only portfolio. It assumes 1,000 targeted high-consumption devices (vending machines, water coolers, window units, heaters, and large displays) across a commercial portfolio in PJM. All inputs are illustrative assumptions, not guarantees.
Energy Savings
The education pilot measured savings of 290–2,190 kWh per device per year depending on device type [16]. Assuming an average of 1,000 kWh saved per targeted device:
- Annual savings: 1,000 devices × 1,000 kWh = 1,000,000 kWh/year
- At $0.12/kWh (assumed blended rate): about $120,000/year in avoided energy cost
Grid Services Revenue
Assuming an average of 200 W per device is running and curtailable during peak events, the portfolio offers about 200 kW (0.2 MW) of flexible capacity. At PJM’s 2028/2029 capacity price of $325/MW-day [10]:
- Gross capacity value: 0.2 MW × $325 × 365 days = about $23,700/year
- Net to the building owner (assuming a 70% share after aggregator fees): about $16,600/year
Resilience Value
Because every plug is individually controllable, nonessential loads can be shed during grid emergencies or on backup power, stretching generator and battery runtime for critical equipment. This value is real but site-specific, so it is excluded from the totals below.
Combined Economics (Illustrative 1,000-Device Portfolio)
| Category | Annual Value |
|---|---|
| Energy savings | $120,000 |
| Capacity revenue (net to owner) | $16,600 |
| Total annual benefits | $136,600 |
| Ongoing software and connectivity (assumed $2/plug/month) | ($24,000) |
| Net annual benefit | $112,600 |
| Upfront deployment (assumed $200/plug installed) | ($200,000) |
| Simple payback | About 1.8 years |
| 10-year net present value (6% discount rate) | About $629,000 |
Sensitivities: Results depend heavily on device mix, operating hours, and electricity rates. Portfolios weighted toward the heaviest loads, or in higher-rate regions, can pay back far faster; the case studies above saw paybacks as short as 4 months for high-consumption equipment [14][16]. Capacity prices are set annually and may change. The example does not include utility rebates, demand charge reductions, or resilience value.
Implementation Pathways for Facility Managers
Phase 1: Assessment and Baseline (Weeks 1–4)
- Inventory plug loads: Walk through facilities or use network discovery to count devices by type, voltage, and location.
- Target high-consumption devices: Window units and PTACs, vending machines, water coolers, space heaters, and large displays typically deliver most of the controllable load.
- Review utility programs: Identify demand response, efficiency, and non-wires alternative programs in your territory, including enrollment deadlines and measurement requirements.
- Check procurement vehicles: Cooperative purchasing contracts and state contracts may allow direct purchase without a full RFP.
Phase 2: Pilot Deployment (Weeks 5–12)
- Select 50–200 devices across two or three buildings or floors that represent typical load profiles.
- Deploy metered smart plugs that support automated demand response signaling.
- Establish a baseline of at least 14 days of uncontrolled operation.
- Implement schedules aligned with occupancy, with overrides for exceptions.
- Measure and verify savings by device type against the baseline.
Phase 3: Program Enrollment and Scale (Months 4–12)
- Enroll in utility or grid operator programs using your measured data.
- Engage an aggregator if you are not participating directly.
- Scale to the full portfolio, prioritizing buildings with the highest savings and capacity potential.
- Integrate with your BAS or energy management system through an API or BACnet gateway for a unified dashboard.
Phase 4: Optimization and Expansion (Year 2+)
- Add storage or solar where economics support it, after reviewing current federal and state incentives, which changed significantly under 2025 federal legislation.
- Explore ancillary services, which require faster telemetry and response.
- Prepare for FERC Order 2222 aggregation as wholesale market access opens in your region.
- Benchmark against peers using DOE Better Buildings, ENERGY STAR, or ASHRAE Building EQ.
Key Takeaways
- Grid resilience now depends on the demand side. NERC projects 224 GW of summer peak growth over ten years, with 13 of 23 regions at elevated or high risk [1]. DOE calls for 80–160 GW of VPPs by 2030 to help close the gap [2].
- Plug loads are a large, untapped DER pool. They account for roughly a quarter to a third of commercial building electricity [12][13], are largely uncontrolled, and can be made visible and dispatchable with smart plugs in weeks.
- Real-world results are compelling. A NIST Global City Teams Challenge deployment achieved more than 50% average savings with sub-one-year payback; sports venue projections show 9–12 month paybacks; and an education pilot found 4–6 month paybacks on heavy loads [14][15][16].
- The grid is paying for flexibility. PJM capacity prices have cleared at the price cap in each of the last three auctions, most recently $325/MW-day [10], and hyperscalers such as Google are now funding gigawatt-scale VPPs [9].
- Early movers have room to lead. No DER aggregation capacity was offered in PJM’s first Order 2222-eligible auction [7]. Building owners who inventory, meter, and enroll their plug loads now will be ready as markets open.
References
- North American Electric Reliability Corporation. 2025 Long-Term Reliability Assessment. January 2026.
- U.S. Department of Energy. Pathways to Commercial Liftoff: Virtual Power Plants 2025 Update. January 2025.
- The Brattle Group. Real Reliability: The Value of Virtual Power. May 2023.
- California Public Utilities Commission. Emergency Load Reduction Program. Accessed November 2026.
- Federal Energy Regulatory Commission. FERC Order No. 2222 Explainer: Facilitating Participation in Electricity Markets by Distributed Energy Resources.
- PJM Interconnection. DER Aggregator Participation Model: Full Model Design. Distributed Resources Subcommittee, March 2026.
- POWER Magazine. “PJM’s 2028/2029 Capacity Auction Falls Short of Reliability Standard for Second Straight Year.” July 2026.
- Energy-Storage.news. “Google signs 100MW distributed energy resource VPP agreement with Voltus for PJM.” June 2026.
- Google. “We are working with Voltus to build a 1-gigawatt virtual power plant.” October 22, 2026.
- PJM Interconnection. “PJM Capacity Auction Procures 138,318 MW of Generation Resources.” Press release, July 14, 2026.
- Energy-Storage.news. “Energy storage ‘would help counter massive price spikes’ in PJM capacity auctions.” 2025.
- National Renewable Energy Laboratory. Assessing and Reducing Plug and Process Loads in Office Buildings. 2013.
- Lieberman, A., Cox, R. W., and Futrell, B. “Effective Strategies for Reducing Plug Load: Results from a Field Study Conducted at Two of the Largest US Banks.” ASHRAE/IBPSA-USA SimBuild 2020.
- BOSS Controls. Case Study: Plug Load Energy Management, NIST Global City Teams Challenge.
- BOSS Controls. Energy Savings at the Plug Load: Stadiums.
- BOSS Controls. Plug Load Control: Education Facilities Pilot Results.
In this Article
- Grid Resilience and Distributed Energy Resources: Turning Building Loads into Grid Assets
- The Grid Resilience Challenge Is No Longer Theoretical
- Distributed Energy Resources as a Resilience Strategy
- Virtual Power Plants: Aggregation Makes DERs Grid-Scale
- Plug Loads: The Overlooked DER Resource
- Case Studies: From Pilot to Portfolio
- Standards, Interoperability, and Cybersecurity: The Enabling Stack
- Economic Framework: Building the Business Case
- Implementation Pathways for Facility Managers
- Key Takeaways
- References