
Quick Summary
Commercial demand response is no longer just about answering a utility’s curtailment call. Demand charges typically make up 30–70% of a commercial electric bill, and nearly 5 million U.S. commercial customers are eligible for rates above $15/kW. Plug and process loads use about a third of commercial building electricity, and networked smart plugs have cut energy use on controlled equipment by more than 50% in field deployments. This article explains the difference between saving energy and cutting peak demand, how plug load control, battery storage, and wholesale demand response programs fit together, and gives a staged plan facility teams can follow.
Demand response has long sat in an awkward middle ground in commercial energy management. For utilities, it is a reliability tool: a way to shed load during system peaks instead of running expensive peaking plants. For facility managers, it has often been a disruptive obligation. A curtailment notice arrives, operations scramble to cut load, and any financial reward shows up months later as a bill credit.
That is changing. Demand charges typically account for 30–70% of a commercial customer’s electric bill [1], behind-the-meter technology has matured, and wholesale markets are opening to aggregated small loads [9]. Commercial demand response is shifting from occasional emergency curtailment to continuous, automated control over when and how a building draws power. This article draws on NREL’s national survey of demand charges [1], NREL research on storage and plug load reduction [2][3], BOSS Controls field deployments [4][5][6][7], and current federal and grid operator guidance on demand response and virtual power plants [8][9][10].
The Demand Charge Reality
The economic driver for demand response in commercial buildings is the demand charge. Energy charges bill for kilowatt-hours consumed. Demand charges bill for the highest 15-minute period of demand in the month, measured in kilowatts [2]. A single 15-minute spike can set the demand charge for the entire billing period.
NREL and Clean Energy Group surveyed more than 10,000 utility tariffs available to about 70% of U.S. commercial buildings. They estimated that nearly 5 million of the country’s 18 million commercial customers are eligible for tariffs with demand charges above $15/kW, and about 3 million (roughly 15%) are eligible for charges above $20/kW [1]. These are eligibility estimates, not counts of customers actually enrolled on those tariffs.
High demand charges are not confined to the usual high-cost states. The highest state maximums in the survey were $51.25/kW in New York, $46.43/kW in Colorado, $35.45/kW in Arizona, $30.00/kW in Nebraska, and $28.70/kW in Georgia [1]. Variation within a state can be extreme: some New York customers may pay more than $50/kW, while the state’s average utility maximum is $9.30/kW [1].
For facility managers, demand charge management is a national issue, not a niche concern. The same NREL analysis notes that peak demand charges were the most significant predictor of an economically viable behind-the-meter battery [1]. But storage is only one lever. The first and often cheapest lever is controlling the loads that make up the peak.
Plug Loads: A Large, Controllable Share of the Bill
Plug and process loads (PPLs) are everything that plugs into a receptacle: computers, monitors, printers, water coolers, vending machines, coffee makers, space heaters, and window AC units. They account for about 33% of U.S. commercial building electricity consumption [3]. DOE projections cited by NREL expected commercial building energy use to grow 24% by 2030 while PPL energy use grows 49% over the same period [3].
NREL showed how much of this load can be removed. After applying its PPL reduction process, NREL’s Research Support Facility used 1,290,000 kWh/year for plug loads, down from nearly 2,257,000 kWh/year in its previous office space. That is a 43% reduction worth $58,000 a year at NREL’s $0.06/kWh rate [3]. NREL’s guide recommends consolidating equipment (as many as 300 printers can be replaced by as few as 20 multifunction devices), using power management settings, and turning equipment off outside business hours. Office buildings are unoccupied for two-thirds of the year, which makes timed shutdown one of the highest-impact steps [3]. In one NREL example, a $20 outlet timer on an ice machine saved nearly $150 a year [3].
Plug loads affect demand charges only through what they draw during the building’s peak window. Here is an illustrative example. A refrigerated vending machine averages about 420 W when operating [4]. Fifty machines running during the peak 15-minute interval add about 21 kW to the monthly demand. At $20/kW, that is roughly $420 a month in demand charges, before counting water coolers, ice makers, space heaters, and window ACs.
Schedule-Based Control: The Foundation Layer
BOSS Controls’ savings methodology for its smart plug load controllers starts with a monitor-only baseline period of at least seven consecutive normal business days. That is followed by a scheduled period with identical occupied and unoccupied hours, in which devices are switched off when the space is unoccupied [4]. The savings calculation is simple: the energy a device used during unoccupied baseline hours, annualized and multiplied by the facility’s blended electric rate [4]. At $0.11/kWh, typical annual savings include $69 for a 42″ plasma TV (25 W phantom, 280 W operating), $151 for a window AC unit, $274 for a refrigerated vending machine, and $287 for an ice machine [4]. A typical facility with standard business hours has about 114 unoccupied hours per week [4].
The real value comes at scale. In the BOSS commercial case study, smart plugs were installed in commercial office high-rises, a small commercial campus, and light industrial facilities, on copiers and printers, water coolers and fountains, coffee pots, and vending machines [5]. After at least 14 days of baseline data, schedules turned devices off on weekdays before 6:00 AM, after 6:00 PM, and on weekends. A further 14 days or more verified the savings [5]. Energy use and electricity cost both fell by more than 53%, with simple payback under one year for all areas and as short as four months for high-consumption equipment [5].
Results in education were similar. BOSS and its partners installed more than 400 smart plug controllers at three education facilities in contrasting climates, targeting PTACs, window ACs, electric heaters, and plug-in refrigeration [6]. In one public school system’s test (170 plugs across two buildings), electricity use fell from 9,597 kWh in the baseline period to 2,913 kWh in the test period, a 69.7% reduction. The projected payback was 21 months at a relatively low $0.095/kWh rate [6]. Scaled to a full deployment of 111,600 plugs across 372 buildings, the projection shows annual use falling from 65.7 million kWh to 19.9 million kWh [6]. That figure is a projection, not a measured result.
Why not just use plug-in timers? As the education case study puts it, “manual plug timers are rarely used in commercial buildings” because mechanical and non-networked timers are hard to manage [6]. Networked control closes that gap. BOSS’s “virtual groups” let staff schedule, control, and monitor dozens or hundreds of devices as if they were one [4]. Staff can also power down devices remotely when schedules change, such as shutting everything down from home for a Monday holiday or turning off every device on a floor that is empty for the week [4].
From Schedule to Signal: Energy Savings vs. Peak Reduction
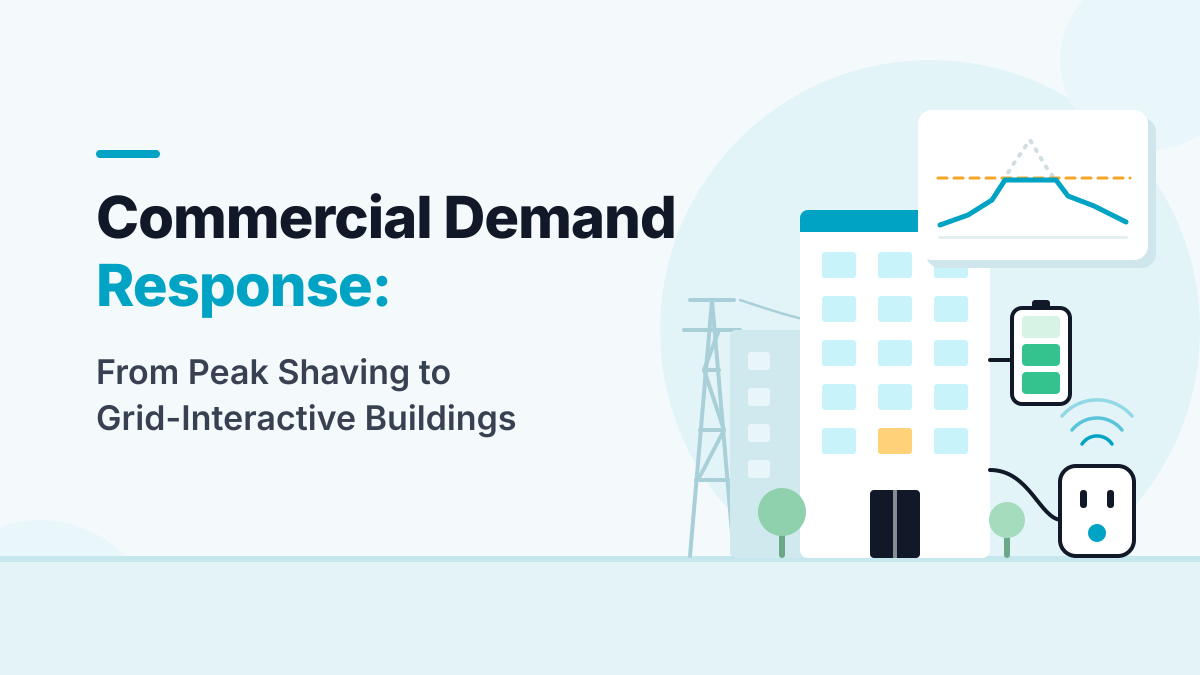
Overnight and weekend shutdowns cut kilowatt-hours. On their own they do not necessarily cut the kilowatt peak that sets the demand charge, because that peak usually occurs during occupied hours. [4]. Cutting the demand charge requires a second capability: shedding discretionary load during the peak window.
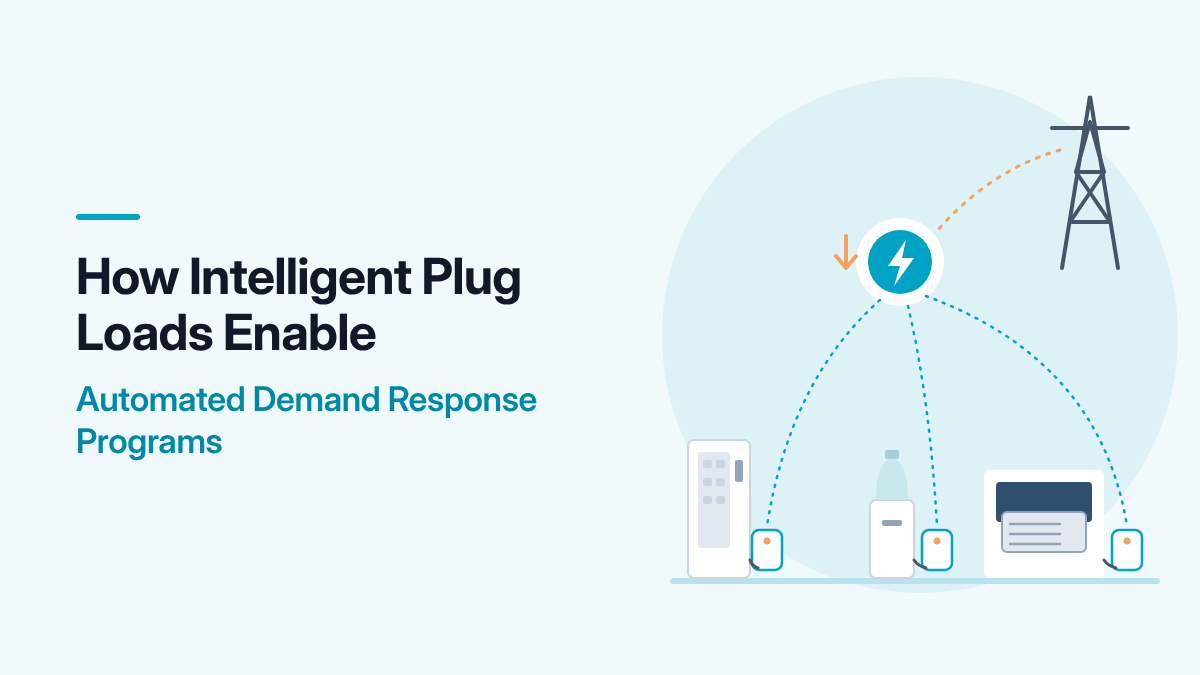
The same networked plugs provide that capability. The BOSS commercial case study notes that connected smart plugs support advanced applications including demand response and peak load management [5]. In a municipal regional partnership deployment, cloud-based control supported automated demand response events down to the plug load level, with measurement and verification. One stated goal was to aggregate plug loads across multiple buildings to take part in demand response events [7]. Because the plugs log power in 10-minute intervals [4], the data needed to see and manage peaks is already being collected.
NREL’s storage research explains why short, targeted curtailment is valuable. Across 98 simulated commercial buildings, savings from demand charge reduction exceeded savings from energy arbitrage by one to two orders of magnitude [2]. Shorter-duration systems had the shortest paybacks, because in typical load profiles the energy needed rises non-linearly as you cut deeper into the peak [2]. In other words, the top of the peak is narrow, and trimming it takes relatively little energy. Briefly cycling off discretionary loads during that window, such as vending compressors, water coolers, ice makers, space heaters, and window ACs, attacks the same narrow band of the peak that a short-duration battery would, without the battery’s capital cost. It does not replace storage for larger or longer peaks.
Energy Savings Calculator
Start your demand response plan with the savings scheduling can lock in now. Enter your plug-in equipment to estimate annual energy use, annual and five-year savings, and CO2 avoided.
The Storage Layer
Plug load control reaches its limit during sustained peaks, when discretionary loads have already been shed but HVAC, lighting, and process loads still drive demand. That is where behind-the-meter storage comes in.
Using its Battery Lifetime Analysis and Simulation Tool (BLAST) with installed costs of $300/kW plus $300/kWh, NREL found payback periods below five years, and as low as three years, for many commercial and industrial buildings [2]. Note the context: the simulation used a Southern California Edison rate of about $30/kW for summer on-peak demand, which NREL described as one of the highest in the nation [2]. Systems with a 30-minute duration (2C) had paybacks about half those of 4-hour (C/4) systems [2]. NREL’s comparison of then-available products found that some high-power batteries already met its cost assumptions while some low-power systems did not [2]. Battery prices have moved a lot since 2017, so use current quotes and your own interval data rather than those figures.
Thermal energy storage is an alternative for cooling-driven peaks. NREL estimated an electrical-equivalent cost of $600/kWh for an Ice Bear 30 ice storage system, more than battery options at the time and useful only during the cooling season [2]. Its advantages are near-100% round-trip efficiency and little loss of cycle life, because the storage medium does not chemically degrade [2]. Phase-change materials such as paraffin melt at a higher temperature than ice, so they can work with a building’s existing DX condensing unit without a second refrigeration cycle. Their thermal conductivity is low, however, so they are often encapsulated in graphite composites to move heat fast enough [2].
The practical takeaway: plug load control is the low-capital first step, and storage is the high-capital second step for sustained peaks. The two work together. A building that automatically sheds discretionary plug loads lowers the residual peak that storage must cover, which shrinks the battery and improves the project economics.
Demand Response Today: From Utility Programs to Virtual Power Plants
The other big change is where demand flexibility can earn revenue. In PJM, the largest U.S. grid operator, demand response lets retail customers take part in wholesale energy, capacity, and ancillary services markets and be paid for reducing demand [10]. Most activity is in the capacity market, where participants can be paid for committing to reduce demand up to three years ahead [10]. Curtailment Service Providers aggregate customers’ curtailment capability, offer it into the market, and verify reductions [10]. One rule matters for facility teams: economic demand response is not paid for reductions that are part of normal operations [10]. Routine schedules save energy, but event-driven curtailment is what earns demand response payments.
The value of that flexibility has risen. PJM’s 2024 capacity auction cleared at prices nearly 10 times higher than the previous year’s. Ratepayers are responsible for $14.7 billion in capacity costs for the 2025–2026 delivery year, compared with $2.2 billion for 2024–2025 [8]. FERC Order No. 2222, issued in 2020 and updated in 2021, requires regional grid operators to let aggregations of distributed energy resources take part directly in their markets. Aggregations can be as small as 100 kW [9]. Implementation has been uneven: as of December 2024, CAISO and ISO-NE were the only grid operators fully in compliance, while PJM, MISO, and SPP plan to implement much of their compliance several years later [8].
DOE’s 2025 virtual power plant (VPP) assessment estimates that about 30 GW of VPP capacity is enrolled today. Enrolling 30–50% of the new dispatchable distributed capacity expected by 2030 would reach 80–160 GW, enough to serve 10–20% of peak demand [8]. Plug loads fit this model well because they are numerous and spread across many buildings. As an illustration, 200 window AC units at about 1.25 kW each [4] add up to roughly 250 kW of controllable load across a portfolio. That is well above the 100 kW aggregation size FERC contemplated [9], and it is available within seconds through the same platform that runs daily schedules.
Practical Implementation Pathway
For facility managers evaluating commercial demand response, the evidence supports a staged approach. The Stage 1 outcomes come from the field results cited above. The targets for Stages 2–4 are illustrative planning targets, not results from the cited studies; actual results depend on your load profile and tariff.
Stage 1: Baseline and Schedule (Weeks 1–4)
- Meter target plug loads for at least 7 consecutive normal business days to establish a baseline [4]
- Prioritize high-consumption devices with many unoccupied hours: vending machines, water coolers, ice makers, window ACs, PTACs, and space heaters [6]
- Deploy networked smart plugs and group devices by floor, building, or equipment type
- Set occupied/unoccupied schedules that match actual building hours
- Verify savings by comparing a scheduled period with identical hours to the baseline
- Outcome seen in field deployments: 50%+ energy reduction on controlled devices, with paybacks from about 4 months to under 2 years depending on electric rates [5][6]
Stage 2: Real-Time Peak Awareness (Months 2–3)
- Set up a dashboard comparing 15-minute rolling demand with the current monthly peak
- Set alerts for when demand approaches about 90% of the monthly peak
- Enable a one-click “peak shave” group that sheds discretionary plug loads
- Coordinate with the building automation system for HVAC setback during peak windows
- Illustrative target: 5–15% demand charge reduction
Stage 3: Automated Peak Limiting (Months 3–6)
- Automatically shed prioritized discretionary loads when rolling demand exceeds a threshold
- Add predictive scheduling using weather forecasts and utility peak-day notifications
- Protect critical loads: never shed life safety, IT, or process-critical equipment
- Enroll the controllable load with a utility program or Curtailment Service Provider [10]
- Illustrative target: 15–25% demand charge reduction, consistent month to month
Stage 4: Storage Integration (Year 1–2)
- Evaluate storage economics using actual 15-minute interval data and your tariff
- Size storage for the residual peak after plug load shedding; short-duration systems tend to pay back fastest [2]
- Coordinate storage dispatch with plug load shedding to stack demand charge savings, demand response payments, and resilience
- Illustrative target: 25–40% total demand charge reduction
Key Takeaways
- Demand charges drive the economics. They typically make up 30–70% of a commercial electric bill, nearly 5 million U.S. commercial customers are eligible for rates above $15/kW, and peak demand charges are the strongest predictor of battery viability [1].
- Plug loads are a large, controllable target. They use about 33% of commercial building electricity [3], and schedule-based control has cut energy use on controlled devices by 53–70% in BOSS field deployments [5][6].
- Energy savings and peak reduction are different jobs. Overnight schedules cut kWh. Lowering the demand charge requires shedding discretionary load during the peak window, which networked plugs also enable [4][5].
- Networked control closes the execution gap. Manual timers rarely get used at scale, while group-based scheduling manages hundreds of devices as one system [4][6].
- Demand response is becoming a revenue stream. Higher capacity prices, FERC Order No. 2222, and the growth of virtual power plants are opening wholesale markets to aggregated building loads [8][9][10].
- Staged implementation reduces risk. Start with proven, low-cost scheduling, then add peak awareness, automated limiting, and finally storage, with each stage informing the next.
References
- National Renewable Energy Laboratory and Clean Energy Group. Identifying Potential Markets for Behind-the-Meter Battery Energy Storage: A Survey of U.S. Demand Charges. NREL/BR-6A20-68963, August 2017. https://docs.nlr.gov/docs/fy17osti/68963.pdf
- National Renewable Energy Laboratory. Overview of Distributed Energy Storage for Demand Charge Reduction. https://docs.nlr.gov/docs/fy17osti/1496630.pdf
- National Renewable Energy Laboratory. Assessing and Reducing Plug and Process Loads in Office Buildings. NREL/BR-5500-54175. https://docs.nlr.gov/docs/fy13osti/54175.pdf
- BOSS Controls. Understanding & Calculating Energy Savings for a BOSS Load Controller (Smartplug). 2016. Available from BOSS Controls on request.
- BOSS Controls. Case Study: Commercial Building Plug Load Control. https://bosscontrols.com/case-study/commercial-building-plug-load-control/
- BOSS Controls. Energy Savings Case Studies: Education (Advanced Plug Load Control for Schools & Universities). https://bosscontrols.com/case-study/advanced-plug-load-control-for-schools-universities/
- BOSS Controls. Case Study: Regional Partnership for Plug Load Control (Municipal). https://bosscontrols.com/case-study/regional-partnership-for-plug-load-control/
- U.S. Department of Energy. Pathways to Commercial Liftoff: Virtual Power Plants 2025 Update. 2025. https://www.smartenergydecisions.com/wp-content/uploads/2025/04/liftoff_doe_virtualpowerplants2025update.pdf
- Federal Energy Regulatory Commission. FERC Order No. 2222 Explainer: Facilitating Participation in Electricity Markets by Distributed Energy Resources. https://www.ferc.gov/ferc-order-no-2222-explainer-facilitating-participation-electricity-markets-distributed-energy
- PJM Interconnection. Demand Response Fact Sheet. June 2026. https://www.pjm.com/-/media/DotCom/about-pjm/newsroom/fact-sheets/demand-response-fact-sheet.ashx