
Quick Summary
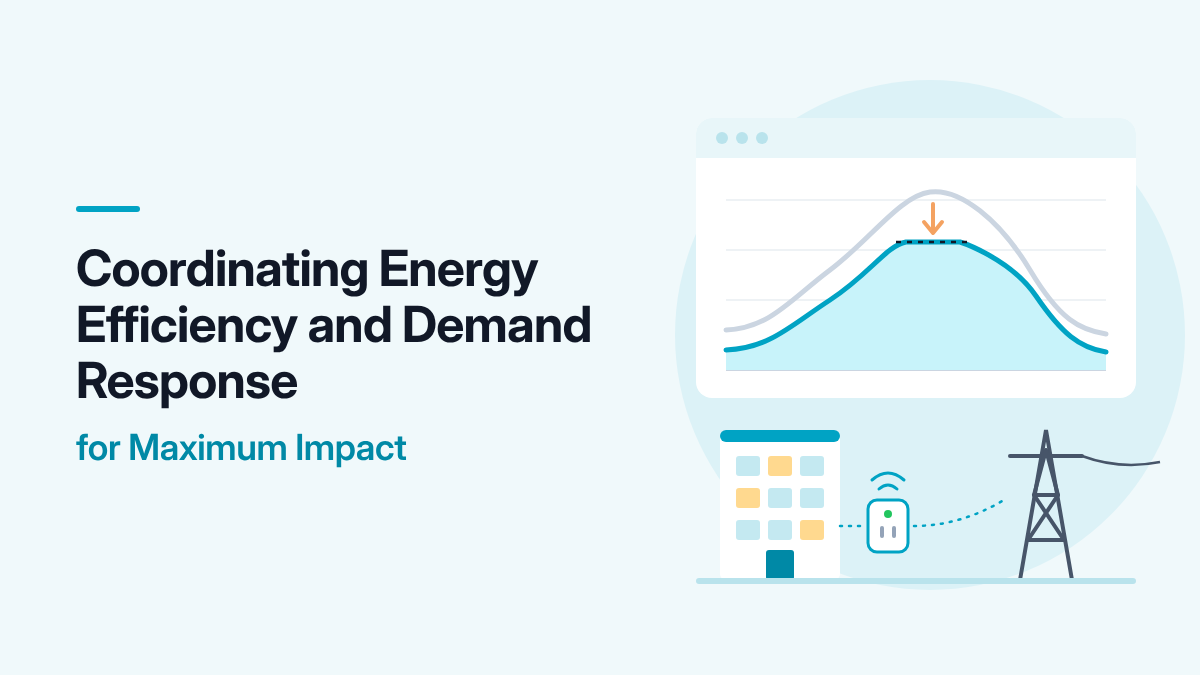
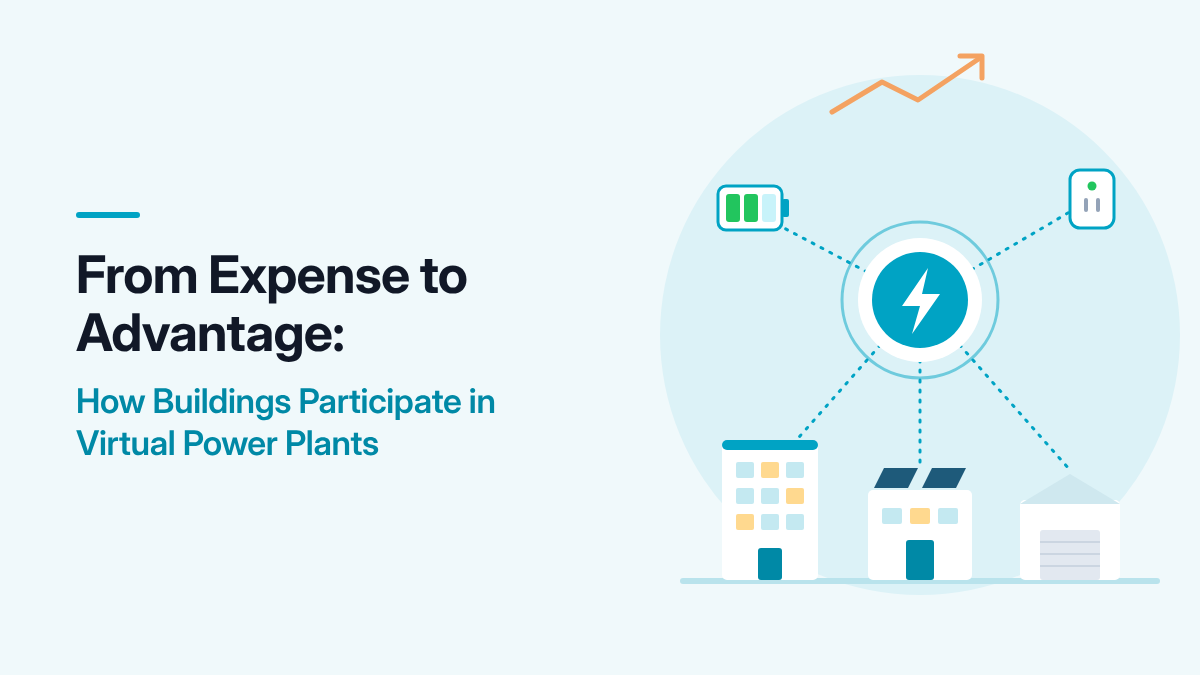
Virtual power plants (VPPs) pool flexible loads and other distributed energy resources to give the grid power when it needs it most, and commercial buildings are well suited to join them. By reducing HVAC, lighting, plug loads, or EV charging for a few hours during peak events, a building can earn capacity and energy payments, lower its demand charges, and turn electricity from a pure expense into a source of value. This article explains how VPPs work, where the revenue comes from, how participation works through utilities and aggregators, and how facility teams can get started.
Introduction: The Grid Needs Flexibility, and Buildings Have It
For most commercial buildings, electricity is a line item to be managed: a cost that rises with rates, demand charges, and the weather. That view is starting to change. After nearly two decades of essentially flat electricity demand, the U.S. is entering a period of rapid growth, and grid operators and utilities are looking for fast, affordable ways to meet peak demand. One of the most promising is already inside the buildings they serve.
The U.S. Energy Information Administration (EIA) reports that electricity consumption was essentially flat from the mid-2000s to the early 2020s, as efficiency gains and a shift toward less energy-intensive industries offset economic and population growth. Consumption has risen since 2020, led by commercial buildings, including data centers, and manufacturing, and EIA expects it to reach a new record in 2026 [1]. Utility planning has shifted just as sharply: Grid Strategies, an energy consulting firm, found that utilities’ aggregate five-year load forecasts now call for about 166 GW of growth by 2030, roughly six times the growth they forecast in 2022 [2].
The U.S. Department of Energy (DOE) likewise expects peak demand to grow from about 800 GW in 2024 to about 900 GW by 2030, driven by data centers, domestic manufacturing, and electrification. Its 2025 update on virtual power plants (VPPs) puts current U.S. VPP capacity at roughly 30 GW and calls for 80 to 160 GW by 2030, enough to meet 10% to 20% of peak load [3]. Commercial buildings, with their HVAC systems, lighting, plug loads, EV chargers, and batteries, are a large part of that potential.
This article explains what a virtual power plant is, how buildings earn money by joining one, how participation works in practice, and how facility teams can get started.
What Is a Virtual Power Plant?
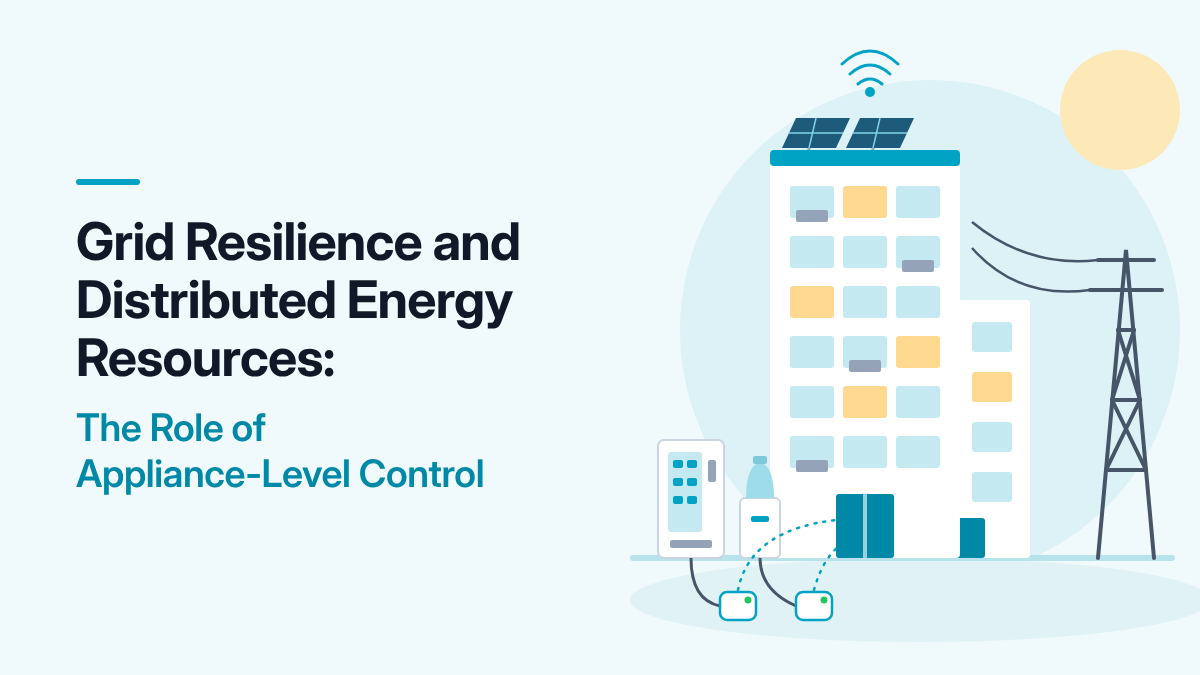
A virtual power plant is an aggregation of distributed energy resources (DERs), such as rooftop solar with batteries, EV chargers, electric water heaters, smart buildings and their controls, and flexible commercial and industrial loads, that is coordinated to balance supply and demand and provide grid services the way a conventional power plant does [3]. Instead of building a new peaking plant that runs a few hundred hours a year, a grid operator can call on thousands of buildings to reduce or shift their load for a few hours.
The economics are compelling. A study by The Brattle Group, prepared for Google, found that a VPP built from residential demand flexibility could provide resource adequacy at a net cost of roughly 40% to 60% of the cost of a gas peaker or a utility-scale battery [4]. Commercial loads differ from residential ones, but the core advantage is the same: VPPs use equipment that already exists.
For a building owner, the shift is simple to state. Load that was purely an expense becomes a resource with market value.
How Buildings Earn Value in a VPP
Participation can create several streams of value, which often stack together:
- Capacity payments. Buildings commit in advance to reduce load when called, and are paid for being available. In PJM, most demand response activity takes place in the capacity market, where resources can commit up to three years ahead and face financial penalties if they fail to perform [5].
- Energy payments. In economic demand response, buildings offer load reductions into day-ahead or real-time energy markets and are dispatched when their offer is below the market price [5].
- Ancillary services. Loads that can respond within minutes or seconds may qualify for reserve and regulation markets, though these require faster response and telemetry [5].
- Lower utility bills. The same controls that respond to grid events also trim peaks on ordinary days, reducing demand charges, which typically make up 30% to 70% of a commercial customer’s electric bill [6].
- Utility incentives. Many utilities pay customers to enroll in their own demand response or VPP programs, separate from wholesale markets.
Capacity value has risen sharply in some markets. PJM’s auction for the 2028/2029 delivery year cleared at its $325 per MW-day price cap across the region, the third consecutive auction to clear at the cap, and demand response made up about 5% of the capacity that cleared [7]. At that price, each 100 kW of reliable load reduction committed to the capacity market is worth about $11,900 a year in gross capacity value, before the aggregator’s share and any performance adjustments.
How Participation Works in Practice
Most buildings do not join wholesale markets on their own. They work through an intermediary that handles registration, bidding, dispatch, and settlement.
Utility programs. The simplest route is often a utility demand response or VPP program. The utility sets the rules, sends event notices, and pays incentives directly.
Curtailment service providers and aggregators. In wholesale markets, buildings typically participate through an aggregator. In PJM, these are called curtailment service providers (CSPs): they aggregate customers’ curtailment capability, register it with PJM, offer it into the market, submit load data to verify reductions, and receive payment, which they share with the customer under a private agreement [5].
DER aggregations under FERC Order No. 2222. FERC’s Order No. 2222 requires grid operators to let aggregations of distributed resources, as small as 100 kW in total, participate directly in wholesale energy, capacity, and ancillary services markets [8]. Implementation is phased by region; in PJM, FERC’s explainer lists capacity market participation starting with the 2028/2029 delivery year and energy and ancillary services markets in 2028 [8]. As these rules take effect, buildings will be able to combine load flexibility with solar, storage, and EV charging in a single aggregation.
Whatever the route, participation follows a similar cycle:
- Enrollment. The building and its aggregator agree on which loads can be curtailed, how much, and for how long.
- Baseline. The program estimates what the building would have used without an event, usually from recent usage on similar days. Reductions are measured against this baseline.
- Notification and dispatch. When an event is called, the aggregator sends a signal, often hours ahead for capacity events and minutes ahead for faster services. Automated controls carry out the response.
- Measurement and verification. Interval meter data shows how much load was actually reduced.
- Settlement. Payments, and any penalties for underperformance, flow back through the aggregator to the building.
One rule is worth noting: grid operators pay only for reductions beyond normal operations. PJM states that demand response “does not include reductions in electricity use that follow normal operating patterns or behavior” [5]. Equipment that is already scheduled off at night is efficiency, not demand response. VPP value comes from loads that would otherwise be running when the grid needs relief.
Which Building Loads Make Good VPP Resources?
The best VPP resources can be reduced or shifted for a few hours without disrupting the building’s core function:
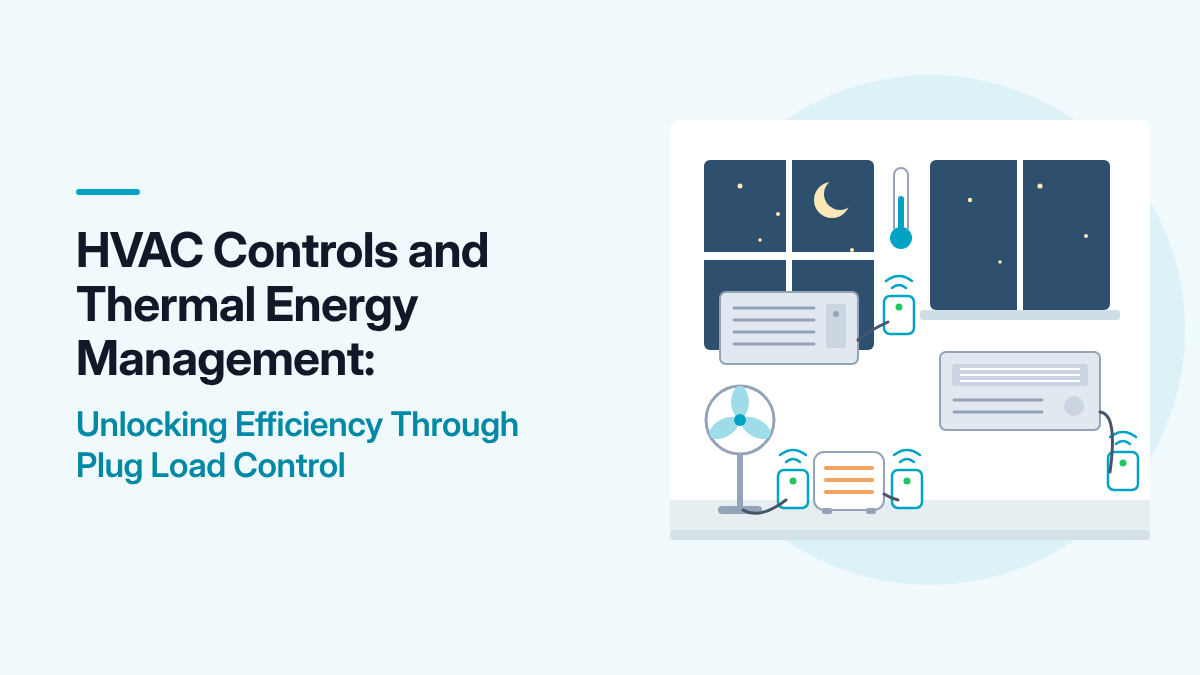
- HVAC. Pre-cooling before an event and allowing temperatures to drift a few degrees during it can shed significant load, especially in large buildings with thermal mass.
- Lighting. Dimming in daylit or lightly used spaces is fast and often unnoticed.
- Plug loads. Water heaters, vending machines, supplemental window AC units, and other discretionary equipment can be switched off briefly. NREL reports that plug and process loads account for about one-third of U.S. commercial building electricity [9], yet most of this equipment sits outside the building automation system.
- EV charging. Charging can often be paused or slowed during events and resumed afterward.
- Batteries and thermal storage. Stored energy can cover building load during peaks, providing reliable, precisely controllable reductions.
The common requirement is control and visibility. A load that can’t be measured can’t be verified, and a load that can’t be controlled automatically is hard to count on during a 4 PM heat wave event.
Energy Savings Calculator
Start your VPP readiness with the savings you can lock in now. Enter your plug-in equipment to estimate annual energy use, annual and five-year savings, and CO2 avoided.
Getting Started: A Practical Path for Facility Teams
- Inventory flexible loads. List equipment that could be reduced, shifted, or paused, along with its typical demand during peak hours. Device-level metering helps a great deal here.
- Lock in efficiency first. Schedule unnecessary loads off during unoccupied hours before committing capacity. This lowers bills immediately and ensures DR commitments are sized on the building’s real operating load.
- Automate control. Connect flexible loads to a control platform that can receive event signals and act on them without staff intervention.
- Choose a participation route. Compare utility programs with aggregator offers, including revenue share, penalty terms, event frequency, and notification times.
- Start conservatively. Commit less than your estimated maximum in the first season, measure actual performance, then increase commitments with confidence.
- Review and expand. After each season, use event data to refine strategies, add loads, and consider storage or EV charging to deepen flexibility.
Plug Loads as an On-Ramp to VPP Participation
Plug loads offer one of the lowest-cost ways to bring a building into a VPP, because smart plugs add metering and control to existing equipment without rewiring. BOSS Controls’ deployments illustrate the approach.
In a pilot with New York City’s Department of Citywide Administrative Services (DCAS), BOSS Controls and Verizon reported installing grid-interactive smart plugs on 419 window air conditioners in two legacy office buildings without central HVAC. The partners reported $40,000 in savings from automating off-hours operation, 300 kW committed to demand response yielding $60,000 in new revenue, and 300 to 450 kW of additional load brought under management.
In an earlier deployment with a large Mid-Atlantic city, a local university, and the city’s largest office tower, BOSS Controls reports that scheduling cut energy use by more than 50% for targeted plug loads and that cloud-based control supported automated demand response events down to the individual plug. BOSS originally estimated about $9.10 a year in demand response value per plug using 2015/16 PJM capacity prices; scaled to the 2028/2029 price of $325 per MW-day [7], the same estimate would be roughly $22 per plug a year, before the aggregator’s share.
Conclusion
Virtual power plants change the relationship between buildings and the grid. Load that was once only a cost becomes a flexible resource that utilities and grid operators will pay for, and the controls that make it possible also cut everyday energy and demand costs. With capacity prices high in markets like PJM, FERC Order No. 2222 opening wholesale markets to DER aggregations, and DOE calling for a large expansion of VPP capacity by 2030, the opportunity for commercial buildings is growing quickly. Facility teams that inventory their flexible loads, automate control, and start with conservative commitments can turn their buildings from passive consumers into active, paid participants in the grid.
Key Takeaways
- After nearly two decades of essentially flat demand, U.S. electricity use is rising again, driven by data centers, manufacturing, and electrification, which makes flexible building load more valuable [1].
- Virtual power plants aggregate distributed resources, including flexible building loads, to provide grid services; DOE calls for 80 to 160 GW of VPPs by 2030, up from roughly 30 GW today [3].
- Buildings can earn capacity payments, energy and ancillary services payments, utility incentives, and lower demand charges from the same flexible loads.
- In PJM, capacity cleared at $325 per MW-day for 2028/2029, making each 100 kW of reliable load reduction worth about $11,900 a year in gross capacity value [7].
- Most buildings participate through utility programs or aggregators (curtailment service providers in PJM), and FERC Order No. 2222 is opening wholesale markets to DER aggregations as small as 100 kW [5][8].
- Only reductions beyond normal operations are paid, so lock in efficiency first and size commitments on the building’s actual operating load.
- Plug loads, HVAC, lighting, EV charging, and storage are all candidates; smart plug control offers a low-cost on-ramp because it adds metering and automated control to existing equipment.