
Quick Summary
Energy efficiency cuts how much energy a building uses all year; demand response cuts how much power it draws during the few hours the grid needs it most. Managed separately, the two can undercut each other through shrinking baselines and double-counted savings. Managed together, they share the same controls and data, lower both energy and demand charges, and earn program revenue. This article explains how the two differ, where they conflict and reinforce each other, and offers a step-by-step playbook for coordinating them, with plug loads as a practical place to start.
Introduction: Two Tools, Often Managed Apart
Energy efficiency and demand response are two of the most valuable tools a commercial building has for cutting costs and supporting the grid. In many organizations, though, they live in separate silos. Efficiency projects are planned by facilities and capital teams, funded through utility rebates, and judged on annual kilowatt-hour savings. Demand response is often an afterthought: an enrollment form with a curtailment service provider and a scramble to shed load when an event is called.
Treating them separately leaves money on the table and can even set the two against each other. Treated as one strategy, they reinforce each other. The U.S. Department of Energy (DOE) makes this combination the centerpiece of its vision for grid-interactive efficient buildings, setting a national goal of tripling the energy efficiency and demand flexibility of the buildings sector by 2030 relative to 2020 levels. The roadmap estimates that grid-interactive efficient buildings could save the U.S. power system $100 billion to $200 billion over two decades [1].
This article explains how efficiency and demand response differ, where they can work against each other, and how facility and energy managers can coordinate them to capture the full value of both.
Efficiency and Demand Response Do Different Jobs
Energy efficiency permanently reduces the energy (kWh) a building needs to deliver the same service. Upgrading lighting, improving HVAC controls, and switching off equipment when spaces are empty all lower consumption every day, all year. The payoff is a smaller energy bill, lower emissions, and a lighter load on the grid at all hours.
Demand response (DR) temporarily changes when and how much power (kW) a building draws, usually in response to a price signal or a grid operator’s call during peak conditions. Researchers at Lawrence Berkeley National Laboratory (LBNL) group demand response into four services [2]:
- Shape: reshaping load profiles through prices or behavioral programs, planned months to days ahead.
- Shift: moving consumption from high-demand periods to times of surplus, such as midday solar.
- Shed: curtailing load to provide peak capacity or emergency support.
- Shimmy: adjusting load dynamically, over seconds to an hour, to smooth ramps and disturbances.
The distinction matters financially. Efficiency mostly reduces energy charges, while demand response, and peak management generally, targets demand charges and DR program payments. Demand charges are a large share of many commercial bills: a National Renewable Energy Laboratory (NREL) survey found they typically make up 30% to 70% of a commercial customer’s electric bill, and nearly 5 million U.S. commercial customers can subscribe to tariffs with demand charges above $15 per kW [3]. A strategy that only reduces kWh misses much of that opportunity, and a strategy that only reacts to events misses the year-round savings.
Where They Can Work Against Each Other
Coordinating efficiency and demand response starts with understanding the friction points.
Baseline erosion. Demand response is paid for the load you reduce below a baseline, usually an estimate of what you would have used without the event. Every efficiency improvement lowers that baseline, so a building that has already cut its load has less left to shed. That is not a reason to delay efficiency; permanent savings are almost always worth more than occasional event payments. It is a reason to size DR commitments on the building’s post-efficiency load rather than on last year’s usage, so you don’t overpromise and face penalties.
No double counting. Grid operators pay only for reductions beyond what a customer would normally do. PJM Interconnection, for example, states that demand response “does not include reductions in electricity use that follow normal operating patterns or behavior,” and economic DR in its energy markets is compensated only for reductions that are not part of normal operations [4]. A schedule that already switches equipment off every night is efficiency, not demand response, and it won’t earn DR payments a second time. DR value comes from loads that would otherwise be running during the event window.
Competing claims on the same equipment. If HVAC setpoints are already tightened for efficiency, a DR event that raises them further can push spaces past comfort limits. Without a shared plan, the efficiency team and the DR program can end up pulling on the same lever in different directions.
Where They Reinforce Each Other
Handled deliberately, the same investments serve both goals.
Shared infrastructure. The controls that schedule equipment for efficiency are the same controls that shed it during an event. Device-level metering that proves efficiency savings also verifies DR performance. Building that capability once and using it twice improves the return on both.
Better data, better baselines. Interval data from metered loads makes baselines more accurate and DR nominations more realistic, which reduces the risk of underperformance penalties.
Events as audits. A DR event is a live test of which loads a building can live without. Equipment that can be shed for two hours on a hot afternoon with no complaints is often equipment that can be scheduled off permanently during low-use periods, turning a one-time event reduction into lasting efficiency.
Lower peaks year-round. Efficiency lowers the whole load curve, including the peak, which reduces demand charges even on days without events. Demand response then trims the remaining peak when it matters most.
A Coordinated Playbook for Facility Teams
The following sequence helps facility and energy managers capture both kinds of value without the two programs undercutting each other.
- Inventory and classify loads. List the major loads and sort them into three groups: loads that can be off whenever spaces are unoccupied (efficiency candidates), loads that are needed during occupied hours but can be curtailed briefly (DR candidates), and critical loads that should never be touched.
- Lock in efficiency first. Implement schedules, setbacks, and upgrades before setting DR commitments. This avoids overstating DR capacity and ensures the baseline reflects how the building will actually run.
- Size DR commitments on the new baseline. Use post-efficiency interval data to estimate how much load you can reliably shed during typical event windows, and build in a margin.
- Build a tiered shed list. Rank curtailable loads by impact on occupants, starting with discretionary equipment such as supplemental cooling, water coolers, vending machines, and decorative displays before moving to anything that affects core operations.
- Automate both programs on one platform. Run efficiency schedules and DR dispatch from the same control system, so event responses override routine schedules cleanly and nothing is shed twice or forgotten.
- Measure and report them separately. Track efficiency savings against a pre-project baseline and DR performance against event baselines. Separate reporting keeps program payments clean and shows the value of each.
- Review after every season. Use event results to find new efficiency opportunities, update shed lists, and adjust next season’s DR nominations.
Energy Savings Calculator
Efficiency comes first. Enter your plug-in equipment to estimate annual energy use, annual and five-year savings, and CO2 avoided before you size your demand response commitments.
Plug Loads: Where Coordination Pays Off Quickly
Plug loads are an ideal place to put this playbook into practice. NREL reports that plug and process loads account for about one-third of U.S. commercial building electricity consumption [5], yet much of this equipment sits outside the building automation system with no scheduling or metering at all.
Smart plug control addresses both sides of the strategy with one installation. Schedules switch equipment off at night and on weekends (efficiency), and the same plugs can shed discretionary loads during occupied-hour peaks (demand response). In a deployment with a large Mid-Atlantic city, a local university, and the city’s largest office tower, BOSS Controls reports that schedule-based shutdown cut energy use by more than 50% for targeted plug loads, with simple paybacks under one year. BOSS also estimated, using 2015/16 PJM capacity prices, that each smart plug could add about $9.10 a year in demand response value on top of the energy savings. PJM capacity prices have since risen sharply: the auction for the 2028/2029 delivery year cleared at $325 per MW-day across the PJM region [6], compared with $136 per MW-day for most of PJM in 2015/16 [7]. Scaled to today’s price, the same estimate would be roughly $22 per plug a year, before the share retained by the curtailment service provider and subject to actual event performance.
As an illustration, consider a building with 200 window air conditioners. BOSS Controls’ education-sector pilots report annual savings of about 1,370 kWh per window unit from scheduling, so off-hours control alone would save roughly 274,000 kWh a year. During an occupied-hours peak event, cycling those same units off for a short period at about 0.3 kW each would shed around 60 kW, enough to lower the building’s demand peak and contribute to a DR program through an aggregator. The efficiency savings and the DR reduction come from different hours, so they stack rather than overlap.
The Bigger Picture: Coordinated Buildings as Virtual Power Plants
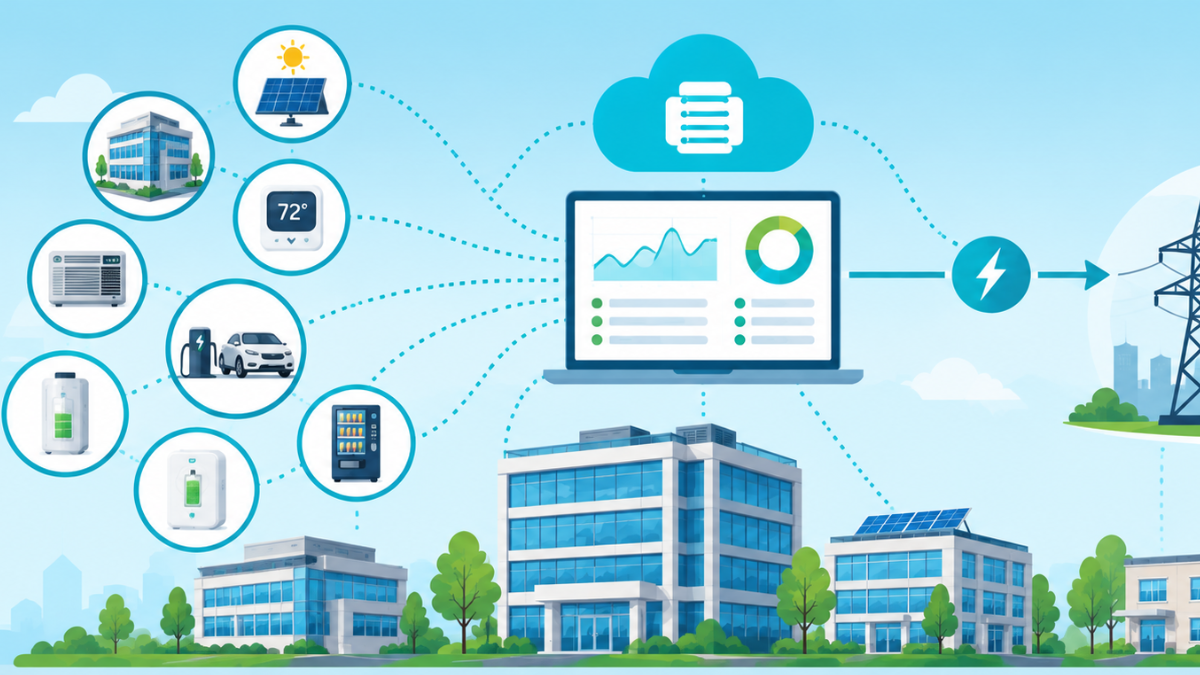
When many buildings coordinate efficiency and demand response, the combined flexibility becomes a grid resource in its own right. DOE estimates that deploying 80 to 160 GW of virtual power plants (VPPs), aggregations of distributed resources such as smart buildings, batteries, and flexible loads, by 2030 could meet 10% to 20% of U.S. peak demand and save about $10 billion a year in grid costs [8]. A study by The Brattle Group, prepared for Google, found that a VPP built from residential demand flexibility could provide resource adequacy at a net cost of roughly 40% to 60% of the cost of a gas peaker or utility-scale battery [9].
Commercial buildings that have already inventoried their loads, automated their schedules, and proven their shed capacity are best positioned to join these aggregations as markets open further. Coordination today builds that readiness.
Conclusion
Energy efficiency and demand response are not competing priorities. Efficiency reduces what a building uses every hour of the year; demand response shapes when it uses it during the hours that matter most to the grid. Managed separately, they can erode each other’s value through shrinking baselines, double-counted savings, and conflicting control actions. Managed together, they share infrastructure, data, and planning, and deliver lower energy bills, lower demand charges, new revenue, and a building ready to participate in the grid of the future.
Key Takeaways
- Energy efficiency permanently reduces energy use (kWh), while demand response temporarily reduces or shifts power (kW) during peak periods; a complete strategy needs both.
- Demand charges can make up 30% to 70% of a commercial electric bill, so peak management deserves as much attention as kWh savings [3].
- Efficiency lowers DR baselines, and grid operators don’t pay for reductions that are part of normal operations, so implement efficiency first and size DR commitments on the new baseline.
- The same controls and metering serve both programs; automating them on one platform avoids conflicts and doubles the return on the investment.
- Plug loads are a practical starting point: one smart plug installation can deliver off-hours efficiency savings and occupied-hours demand response.
- Buildings that coordinate efficiency and demand flexibility are well positioned to join virtual power plants as those markets grow.